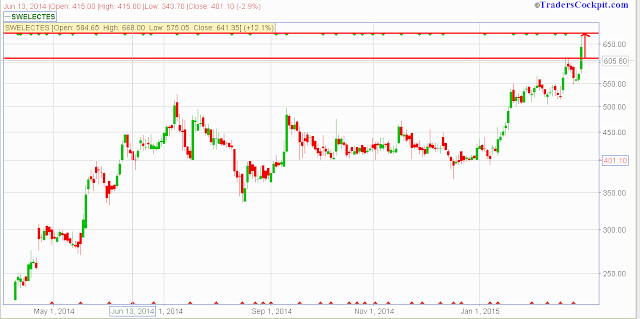
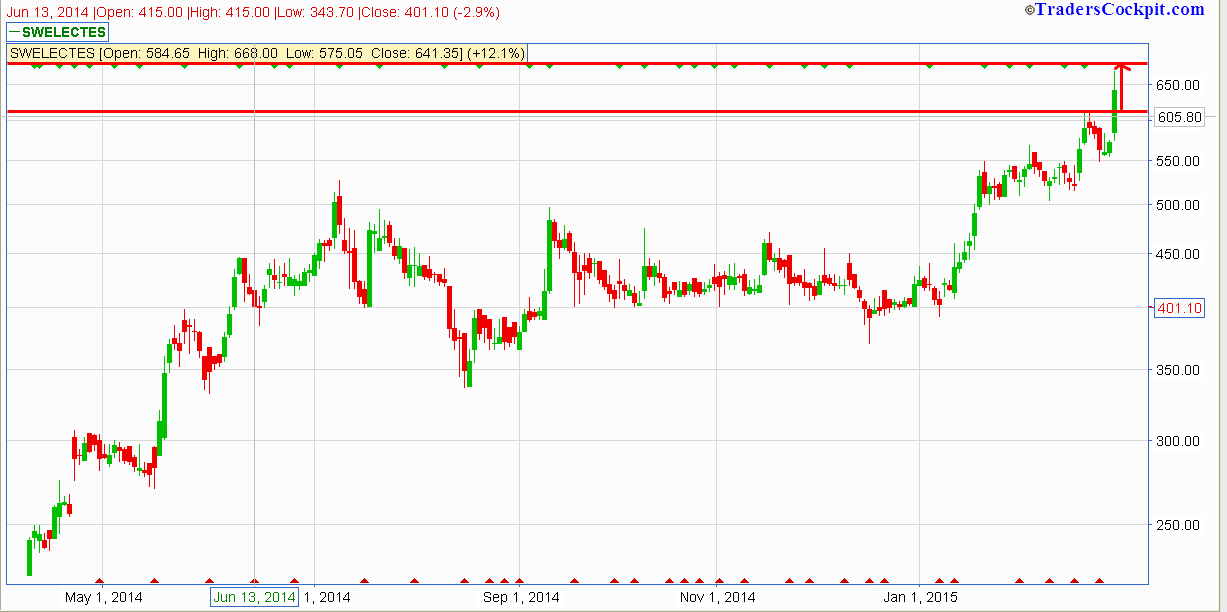
SWELECTES looks a good bet for short term traders , Interesting breakout chart with next level of projections. Looks good for 680-700 .
Some more information about the company as per public sources:
"Swelect Energy Systems, formerly known as (Numeric power Systems Limited), has module manufacturing facility at Bangalore (HHV Solar Technologies Limited), and fully backward integrated facility near Salem that manufactures Solar Power Converter, Array Junction Boxes and Solar Module Mounting Structures. SESL also has a 100% owned subsidiary in Singapore for supporting the group’s international business. In a very short time SWELECT has gained its strength in the solar energy space with the status as a complete product company and a leading PV project implementer. As an experienced Energy Systems Company, SESL successfully launched the Smart Grid projects and has over 20 sites of 40 -100 KW installations to its credit in a short time. Across India, the Company has over 1,500 rooftop installations and has commissioned successfully 2 sites of 1 MW SPV parks each under REC scheme and IREDA scheme. The 12 MW SPV Modular Park at Monjanur Village, Karur District, Tamilnadu, is part of its proposed 15 MW capacity that is aimed at selling part of the capacity to prospective Corporate entities from India and overseas. SWELECT has been ranked as No. 1 Rooftop Solar Company (source Soft Disk Awards 2011, 12, 13) for three consecutive years."
"The government push for raising solar power generation capacity to 100,000 MW by 2022 is a golden opportunity for solar equipment manufacturers. The Narendra Modi government has reportedly raised the solar generation target five-fold from the earlier target of 20,000 MW in 2022 envisaged in the Solar Mission. Fuel shortage, volatility in prices, supply issues and policy paralysis plagued the thermal power generation sector the past couple of years. This brought into focus renewable energy sectors such as wind and solar which do not pose the fuel problems. India, which has about 300 days of sunshine annually, has the potential to host a solar power project almost anywhere. Solar PV installations in India crossed 2.6 GW at the end of FY14 with about 1.1GW of manufacturing capacity commissioned during the current financial year. The government’s solar power push is now expected to bring more manufacturers to the market. The past year has seen a spate of new solar power projects such as the R808-crore 100 MW solar project in Rajasthan, partly funded by the International Finance Corp. Madhya Pradesh is setting up a 750 MW plant touted to be the world’s biggest solar power unit with World Bank partly funding the asset. The ministry of new and renewable energy is rolling out a scheme for setting up 25 solar parks, including ones with ultra mega solar power projects of 500 MW or more. The ministry expects to commission the projects by FY19 and the plan will have an estimated central financial assistance of R4,050 crore. The scheme has got Presidential sanction last month, according to a senior ministry official. Till December 15, 2014, the country has a total commissioned solar manufacturing capacity of 3,002.66 MW, with Gujarat leading the state tally with operating capacity of 929 MW, followed closely by Rajasthan with 839.5" "MW. At CMP, the stock trades at a P/E of 33x FY14 EPS. In Q2FY15, the Company witnessed an outstanding performance. On YoY basis, topline witnessed a whopping growth rate of 216 percent driven by robust growth in solar systems segment whereas on yoy basis it witnessed a growth of 16 percent to touch Rs. 181 mn. The Company reported PAT from loss making both on yoy and qoq basis to touch Rs. 15.89 mn."
Read more: http://traderscockpit.proboards.com/thread/353/buy-swelectes#ixzz3SwWnNQRK
Some more information about the company as per public sources:
"Swelect Energy Systems, formerly known as (Numeric power Systems Limited), has module manufacturing facility at Bangalore (HHV Solar Technologies Limited), and fully backward integrated facility near Salem that manufactures Solar Power Converter, Array Junction Boxes and Solar Module Mounting Structures. SESL also has a 100% owned subsidiary in Singapore for supporting the group’s international business. In a very short time SWELECT has gained its strength in the solar energy space with the status as a complete product company and a leading PV project implementer. As an experienced Energy Systems Company, SESL successfully launched the Smart Grid projects and has over 20 sites of 40 -100 KW installations to its credit in a short time. Across India, the Company has over 1,500 rooftop installations and has commissioned successfully 2 sites of 1 MW SPV parks each under REC scheme and IREDA scheme. The 12 MW SPV Modular Park at Monjanur Village, Karur District, Tamilnadu, is part of its proposed 15 MW capacity that is aimed at selling part of the capacity to prospective Corporate entities from India and overseas. SWELECT has been ranked as No. 1 Rooftop Solar Company (source Soft Disk Awards 2011, 12, 13) for three consecutive years."
"The government push for raising solar power generation capacity to 100,000 MW by 2022 is a golden opportunity for solar equipment manufacturers. The Narendra Modi government has reportedly raised the solar generation target five-fold from the earlier target of 20,000 MW in 2022 envisaged in the Solar Mission. Fuel shortage, volatility in prices, supply issues and policy paralysis plagued the thermal power generation sector the past couple of years. This brought into focus renewable energy sectors such as wind and solar which do not pose the fuel problems. India, which has about 300 days of sunshine annually, has the potential to host a solar power project almost anywhere. Solar PV installations in India crossed 2.6 GW at the end of FY14 with about 1.1GW of manufacturing capacity commissioned during the current financial year. The government’s solar power push is now expected to bring more manufacturers to the market. The past year has seen a spate of new solar power projects such as the R808-crore 100 MW solar project in Rajasthan, partly funded by the International Finance Corp. Madhya Pradesh is setting up a 750 MW plant touted to be the world’s biggest solar power unit with World Bank partly funding the asset. The ministry of new and renewable energy is rolling out a scheme for setting up 25 solar parks, including ones with ultra mega solar power projects of 500 MW or more. The ministry expects to commission the projects by FY19 and the plan will have an estimated central financial assistance of R4,050 crore. The scheme has got Presidential sanction last month, according to a senior ministry official. Till December 15, 2014, the country has a total commissioned solar manufacturing capacity of 3,002.66 MW, with Gujarat leading the state tally with operating capacity of 929 MW, followed closely by Rajasthan with 839.5" "MW. At CMP, the stock trades at a P/E of 33x FY14 EPS. In Q2FY15, the Company witnessed an outstanding performance. On YoY basis, topline witnessed a whopping growth rate of 216 percent driven by robust growth in solar systems segment whereas on yoy basis it witnessed a growth of 16 percent to touch Rs. 181 mn. The Company reported PAT from loss making both on yoy and qoq basis to touch Rs. 15.89 mn."
Read more: http://traderscockpit.proboards.com/thread/353/buy-swelectes#ixzz3SwWnNQRK