Tuesday, 14 October 2014

Rsi Multi-Time-Frame Screener available ...

RSI Multi-Time-Frame- Screener is now available at Traderscockpit. Click here for more details . This is in addition to other multi-time-frame screeners already available for adx, Macd, Bollingerband , Moving averages and Ichimoku.
This is great way of screening and getting overall picture across time frames in single click.
Feedback is appreciated.


Friday, 10 October 2014

NIFTY poised for some more correction

NIFTY seems to be now doing the C leg of the correction as per Elliott wave marking done on TradersCockpit.com latest interactive smartphone based charting tool with inbuilt Elliot wave drawing  tools and fibonacci retracement tools. Look how each wave is corresponding with fibonacci levels on the chart. To know more about this charting tool, call 0-805050-2121 or 0-803-927-5521


Wednesday, 8 October 2014

NTPC Bullish Breakout

As spotted on Realtime Screener on TradersCockpit.com, NTPC has broken above the Upper Bollinger Band today.  It had formed Bollinger W Pattern on September 26th, the same day it was spotted on RSI positive divergence screener as well as Inverted Head & Shoulder pattern screener. Also, our proprietory TC Band Positional Buy Indicator also had generated the Bullish signal that day. Find enclosed all the snapshots. 
To know more about our scanners/screeners, call 0-8050502121 / 0-8039275521 or visit www.traderscockpit.com


Thursday, 3 April 2014

Nifty - Some Short Term Correction on cards?


Nifty meets 261.8% fibonacci target, looks like set for a correction,
 bearish upside gap 2 crows candles formed 

Saturday, 8 February 2014

Nifty Analysis

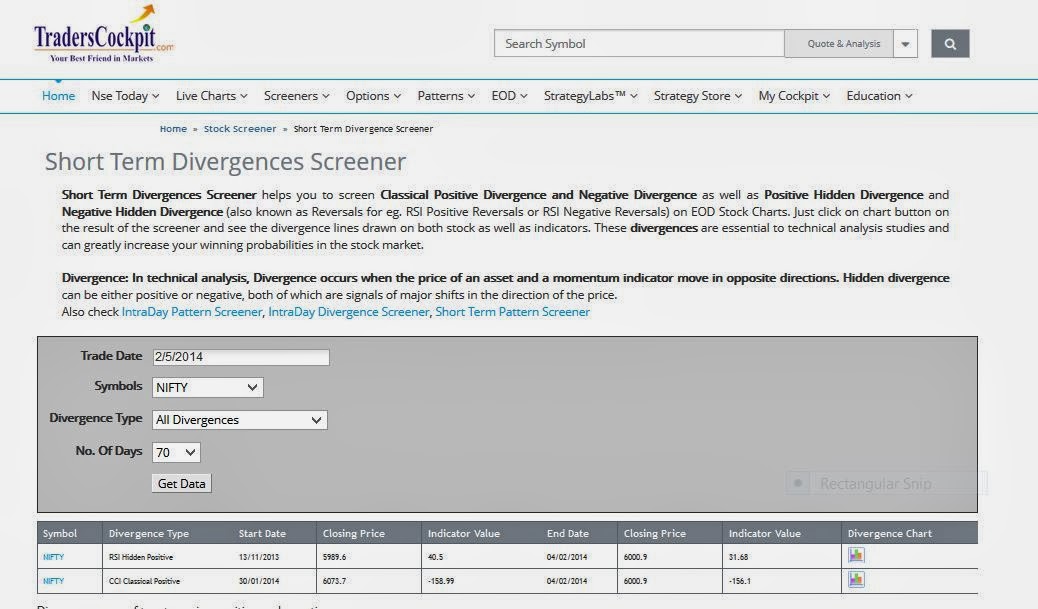
The downfall of Nifty which started on January 24th (it was confirmed by the negative divergence in RSI, CCI etc as shown by our latest divergence screener. See attachments below.).  Click here  to visit the Divergence Screener page.


came to halt with Nifty displaying support near 5930-5950 levels last week. This support level is an important one as it is also the 38.2% fibonacci level (5925) of the entire upmove from 5118 to 6415. The 200 days SMA is at 5977 marking support for Nifty.
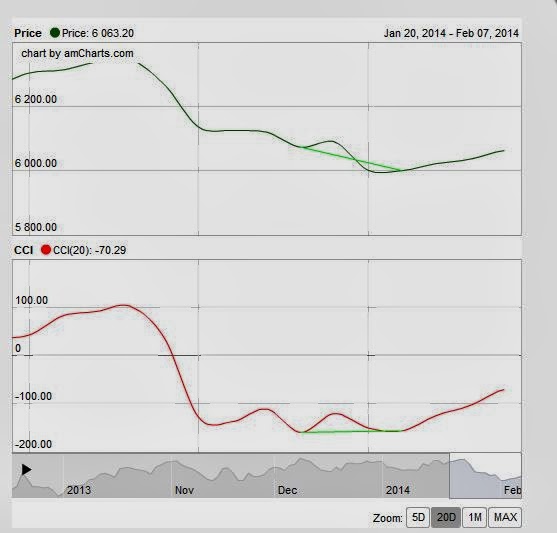
The pullback on 4/2/2014 was confirmed by the positive divergence on RSI and CCI as shown by our latest Divergence Screener. See attachments below.

As long as the 5925-5930 support is not broken on a closing basis, the Nifty will attempt to pullback into 38.2% to 61.8% fibonacci retracement levels as shown on the chart attached. But this area is also marked by 2 gaps as well marking them areas of strong resistance. So, resistance in that area could spark fresh downtrend.

Monday, 8 July 2013

Live Markets - Technical Analysis and Advanced Technical Analysis Course in Mumbai on 13,14 and 15th July

Good Morning !!!
 
TradersCockpit is conducting the Technical Aanalysis and Advanced Technical Analysis Live market course  on 13th, 14th & 15th July at Karl Residency, Andheri West, Mumbai.

About the Course
Technical Analysis is all about learning the Art of Making Profits in all market conditions whether rising or falling. Our Training course will make you understand all the important Power Concepts in the Technical Analysis, help you to learn to understand the Charts, screen out stocks, understand when and where to enter and exit and thereby trade successfully. This workshop is completely dedicated to Technical Analysis Techniques and how it can be applied for Trading Successfully in Stocks, Futures&options and Commodities.. The entire training is conducted over 2 full days on a weekend and one in Live Markets on Monday by highly experienced trainers who are regular traders themselves.

Topics Covered
Day 1
  • Introduction to Technical Analysis and shares, futures and options, commodities markets
  • 5 Power Concepts of Technical Analysis
  • 15 Power Concepts of Candlesticks Analysis
  • How to choose the right time frame to Trade
  • Protective Stops - How to setup and use them
  • What it takes to be a successful Professional Trader
  • What makes Trading different from Gambling
  • Chart Analysis - Different Types of Charts - End of Day and Intraday
  • Candlestick Analysis - 33+ Candlesticks patterns, analysis and Trading System
  • Price, Volume, Open Interest, Trend Lines Analysis

Day 2
  • Pivot Point Analysis & Fibonacci Ratios
  • Moving Averages & different types of Moving Averages such as EMA, SMA, WMA
  • Technical Indicators such as MACD, ADX, RSI, Stochastics, CCI, William %R, Bollinger Bands, ATR, OBV, Fractals and understanding the Buy/Sell Signals on them
  • Divergence - the Strongest Technical Signal in Markets - how to understand / use them
  • Protective Stops, Trailing Buy Stops/ Sell Stops
  • Seven Types of Exit Systems
  • Different timeframe (such as Intraday, daily, weekly) based Charting
  • Risk/money management
  • Position Sizing
  • Trading Systems - Entry, exit, Stoploss
  • Trading Discipline
  • Technical Analysis Software - Get free 1 hour Training

Day 3
  • Creating, Designing and Backtesting Trading Systems
  • StrategyLabs – the Backtesting Software Platform
  • STM Trading System
  • Ichimoku Cloud Trading System
  • DM Trading System
  • Live Trading
Trainer for the Course:
 
Anuraag Saboo is the head of Technical Research at TradersCockpit.com and affiliate member of Market Technicians Association, USA. He has done PGDM from Indian Institute of Management (IIM), Bangalore and Electrical and Electronics Engineering from Indian Institute of Technology (IIT) Chennai. He received Gold medal for being topping his Engineering class in IIT from Dr. Manmohan Singh, the then finance minister. He has 16 + years of work experience in varied industries. He has been actively trading Equities and Commodities on Indian exchanges for over 9 years. 
 
Workshop Fee Details: 

1. Technical Analysis on 13th and 14th July 2013
      Rs 8500/-

2. Advanced Technical Analysis on 14th and 15th July
      Rs 10,900

3. Complete Training (Basic+Advanced Technical Analysis) on 13th,  
     14th and 15th July 2013
     Rs. 14,900

More Details About the workshops :

Since we are hard pressed for time, we shall not be holding another Training in Mumbai for next Three Months. So, please ensure you take the advantage of the same.
Happy Trading !!!!

Friday, 5 July 2013

Lupin may give some of the gains , Gail presenting shorting opportunity

Lupin has given excellent returns in last 6 to 9 months, but it may be a good idea to short Lupin (Trading Call) , as RSI Divergence and  Bearish Reversal Candlestick Patterns are suggesting that it may see some correction in next few trading sessions.

Gail also has been in bullish trajectory for last few days , but it is finding tough to cross 335 levels. Also Bearish Engulfing pattern suggests that it may see some correction in next few trading sessions.

Happy Trading !!!!

Disclaimer: 
These notes/comments have been prepared solely to educate those who are interested in the useful application of Technical Analysis. While due care has been taken in preparing these notes/comments, no responsibility can be or is assumed for any consequences resulting out of acting on them.