Monday, 18 July 2016

GODREJCP TCFL BREAKOUT

GODREJCP has broken out  of  our proprietary indicator TCFL auto drawn on the chart and looks now set to Trend up.  Please find attached the TradersCockpit Advanced Chart with Autodrawn   TCFL Cloud and screener dashboard.  To know more about these advanced tools, please call us on 080-39275521 or 0-8123333977


Wednesday, 29 June 2016

ASIAN PAINTS TC TRENDLINE BREAKOUT

ASIAN PAINTS has broken out of  our proprietary indicator TC Trendline auto drawn on the chart and looks now set to Trend up.  Please find attached the TradersCockpit Advanced Chart with Autodrawn Trendline  and  TCFL Cloud.  To know more about these advanced tools, please call us on 080-39275521

LUPIN - TC Trendline Breakout

LUPIN has broken out of  our proprietary indicator TC Trendline auto drawn on the chart and looks now set to Trend up.  Please find attached the TradersCockpit Advanced Chart with Autodrawn Trendline  and  TCFL Cloud.  To know more about these advanced tools, please call us on 080-39275521


Monday, 25 January 2016

Demystifying Algo Trading in India


As defined by NSE, Automated Trading (also popularly known as Algorithmic Trading or Algo trading in short) shall mean and include any software or facility by the use of which, upon the fulfillment of certain specified parameters, without the necessity of manual entry of orders, buy/sell orders are automatically generated and pushed into the trading system of the Exchange for the purpose of matching.

SEBI has allowed Exchanges to extend Algorithmic trading facility to members involving usage of various Decision Support Tools / algorithms / strategies
 Algorithmic trading can be used either for high frequency trading (HFT) OR quant-based trading.
In HFT, the trade decisions are taken and executed hundreds of times in less than 1 second. So, the strategies require the kind of infrastructure and software management which could only be afforded by Institutionals and they use it for deploying huge amount of funds and predominantly play on arbitrage between instruments / exchanges / indices  etc. So, these are low risk moderate returns strategies deploying huge amount of funds.
In Indian stock markets the Algo trade volume is  predominantly HFT led by Institutionals and was around 40% of total trades in NSE and BSE in March 2015, a substantial increase since 2008 when it was allowed first time here. More than 80% of the Indian institutional trading flow (from both FIIs and Domestic Fund Managers) goes through algorithmic execution currently.
In comparison, Algorithmic trades accounts for over 75% of equity trading in the US markets where it also includes quant based trading as well .
 In Quant based Trading (which also includes technical analysis based trading), the performance over a period of time is analysed with the use of historical data and back testing. Based on this, strategies are developed, tested and optimised. Typically, these strategies would not involve a very high frequency of trades. These are primarily designed to seek alpha and do not involve very high cost infrastructure and therefore very suited for adoption by individuals.
In India, there are Order Management Systems (OMS) available which allow for such trading from companies such as Omnesys and Symphony. But strategy development, backtesting platform which could automate the entire process from start to end, is not available.

Also, educated and informed traders who could create powerful alpha seeking quant strategies are also few in number.
So, despite the benefits of algorithmic trading, since currently it remains too opaque a concept for most, it is not getting adopted.
So, there is clear requirement of an easy-to-configure quant strategies based strategy development, backtesting and deployment platform which could simplify and fructify the quant based algorithmic trading for individual traders.
TradersCockpit has now created such a platform and has acquired the necessary approval from NSE for its algorithms deployed on that platform working along with like-minded brokers and is now set to start offering this to individual traders. To know more, contact the customer support at TradersCockpit or email connect@traderscockpit.com
 Important links to refer to read more about algo trading: 

Sunday, 10 January 2016

Most important company results dates in next 2 months

Most important Company Results dates are below:
To see all companies result/scheduled announcement dates, click here
 
Tuesday, January 12, 2016
IndusInd Bank (INBK')
Tata Consultancy (TCS)
Yes Bank (YESB)

Wednesday, January 13, 2016
Bajaj Auto (BAJA)

Thursday, January 14, 2016
Infosys (INFY)
Reliance Industries (RELI)

Friday, January 15, 2016
Hindustan Unilever (HLL)
Zee Entertainment (ZEE)

Monday, January 18, 2016
Asian Paints (ASPN)
Kotak Mahindra Bank (KTKM)
Wipro (WIPR)

Tuesday, January 19, 2016
HCL Technologies (HCLT)
ITC (ITC)

Wednesday, January 20, 2016
AXIS Bank (AXBK)
Cairn India (CAIL)

Thursday, January 21, 2016
Colgate-Palmolive (COLG)
UltraTech Cement (ULTC)

Monday, January 25, 2016
Idea Cellular (IDEA)
Maruti Suzuki (MRTI)

Tuesday, January 26, 2016
Adani (APSE)

Wednesday, January 27, 2016
Dr. Reddy's Labs (REDY)
Housing Development Finance (HDFC)
Vedanta Ltd (VDAN)

Thursday, January 28, 2016
Bank Of Baroda (BOB)
ICICI Bank (ICBK)
Tech Mahindra (TEML)

Friday, January 29, 2016
Cummins India (CUMM)
Grasim Industries (GRAS)
NTPC (NTPC)

Monday, February 1, 2016
ACC (ACC)
Hero MotoCorp (HROM)
Lupin (LUPN)
Punjab National Bank (PNBK)

Tuesday, February 2, 2016
Bharti Airtel (BRTI)
Tata Power Co. (TTPW)

Thursday, February 4, 2016
GAIL Ltd (GAIL)
TATA STEEL (TISC)

Monday, February 8, 2016
Cipla (CIPL)
Larsen & Toubro (LART)

Tuesday, February 9, 2016
Bharat Petroleum (BPCL)
POWER GRID (PGRD)

Wednesday, February 10, 2016
Bharat Heavy Electricals (BHEL)
Bosch (BOSH)
Coal India (COAL)
Hindalco Industries (HALC)

Thursday, February 11, 2016
Oil & Natural Gas (ONGC)
SBI (SBI)
Tata Motors (TAMO)

Friday, February 12, 2016
HDFC Bank (HDBK)
Mahindra&Mahindra (MAHM)

Monday, February 15, 2016
Ambuja Cements (ABUJ)
Sun Pharma (SUN)

Wednesday,feb 27, 2016
Bharti Airtel (BRTI)

Sunday, 27 December 2015

Brokerage Research Report on Voltas

Excerpt from Research Report published by one of the leading Brokers

At the current market price of 304, based on our estimates, Voltas is trading at FY 2017E and FY2018E P/E of 22.1x and 18.1x, respectively.
With  inflation  under  control,  rate  cuts  announced,  when  coupled  with  Voltas'strong  positioning  in  the  lowly penetrated  AC  market,  comforts  us  that  AC  sales should  continue  to  report  strong  growth,  going  forward.  In  FY2015,  the  UCP segment contributed ~72% of the consol. EBIT.  Also,  completion  of  low  margin  EMP  projects  and  increased  contribution  of  high margin projects indicate that the EBIT margins of the EMP segment would improve from 1.0% in FY2015 to 5.0% in FY2018E. 
On the whole, we expect Voltas to report a top-line and bottom-line CAGR growth of  9.5%  and  13.1%  during  FY2015-18E,  respectively.  Our  growth assumption captures  (a)  pick-up  in  international  award  activity,  which  should  lead  top-line growth  as  well  as  EMP  segment  EBIT  margin  expansion,  (b)  continued  growth  in domestic AC sales, with Voltas being able to retain its ‘Numero Uno’ status.
Noticeably in the  last  few  years, the  EBIT  mix  of  Voltas  has  shifted  from  being
heavily  dependent  on  the  EMP  segment  to a
now  dominant  share  of  the  UCP segment.  The contribution  of  the  UCP  segment  in  the  consol.  EBIT  has  increased
from 32% in FY2011 to 72% in FY2015. We expect the same to be over 64% levels during  FY2016-18E.  Considering  the  shift  in  the  consol.  EBIT  mix,  positive  cues, and  case  for  improvement  in  the  business  segment’s performances,  we  expect
scope for improved profitability and better investment return ratios, going forward.
Considering  the  higher  dependency  on  the  UCP  segment,  we  have  compared Voltas to Hitachi (which is trading at a FY2018 P/E multiple of ~36.0x).
We assign Voltas a 21.0x PE multiple to our FY2018E EPS estimate of 16.8/share and arrive
at a price target of 353 in 12 months time. This reflects 16% upside potential from the current levels.

Thursday, 23 July 2015

TOP Gainer Spotted Through TradersCockpit.com Pattern Screener


Yesterday 5 stocks were spotted for forming Bollinger Band W Patterns on EOD Pattern Screener on TradersCockpit.com. Today, One of them, CAIRN has become the top gainer of the day and  3 of them were among the top 10 gainers on a day when NIFTY is down 0.51%.  Find enclosed all the snapshots. 
To know more about our scanners/screeners, call  0-8039275521 / 0-8050502121 or visit www.traderscockpit.com


Friday, 27 February 2015

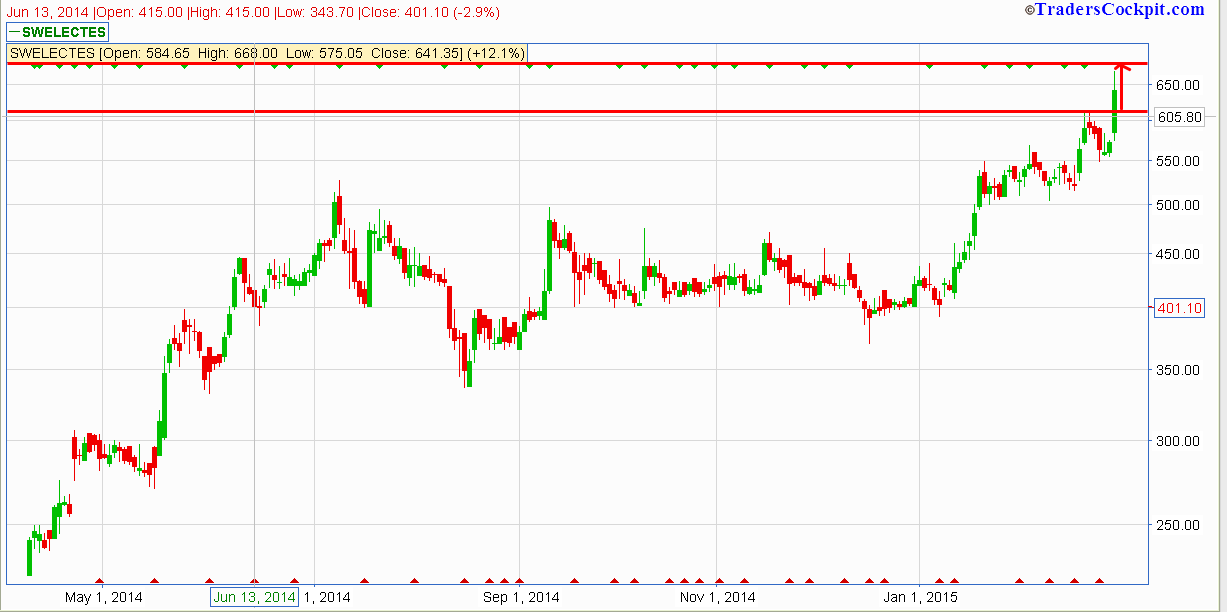
SWELECTES looks a good bet for short term traders , Interesting breakout chart with next level of projections. Looks good for 680-700 .


Some more information about the company as per public sources:

"Swelect Energy Systems, formerly known as (Numeric power Systems Limited), has module manufacturing facility at Bangalore (HHV Solar Technologies Limited), and fully backward integrated facility near Salem that manufactures Solar Power Converter, Array Junction Boxes and Solar Module Mounting Structures. SESL also has a 100% owned subsidiary in Singapore for supporting the group’s international business. In a very short time SWELECT has gained its strength in the solar energy space with the status as a complete product company and a leading PV project implementer. As an experienced Energy Systems Company, SESL successfully launched the Smart Grid projects and has over 20 sites of 40 -100 KW installations to its credit in a short time. Across India, the Company has over 1,500 rooftop installations and has commissioned successfully 2 sites of 1 MW SPV parks each under REC scheme and IREDA scheme. The 12 MW SPV Modular Park at Monjanur Village, Karur District, Tamilnadu, is part of its proposed 15 MW capacity that is aimed at selling part of the capacity to prospective Corporate entities from India and overseas. SWELECT has been ranked as No. 1 Rooftop Solar Company (source Soft Disk Awards 2011, 12, 13) for three consecutive years."


"The government push for raising solar power generation capacity to 100,000 MW by 2022 is a golden opportunity for solar equipment manufacturers. The Narendra Modi government has reportedly raised the solar generation target five-fold from the earlier target of 20,000 MW in 2022 envisaged in the Solar Mission. Fuel shortage, volatility in prices, supply issues and policy paralysis plagued the thermal power generation sector the past couple of years. This brought into focus renewable energy sectors such as wind and solar which do not pose the fuel problems. India, which has about 300 days of sunshine annually, has the potential to host a solar power project almost anywhere. Solar PV installations in India crossed 2.6 GW at the end of FY14 with about 1.1GW of manufacturing capacity commissioned during the current financial year. The government’s solar power push is now expected to bring more manufacturers to the market. The past year has seen a spate of new solar power projects such as the R808-crore 100 MW solar project in Rajasthan, partly funded by the International Finance Corp. Madhya Pradesh is setting up a 750 MW plant touted to be the world’s biggest solar power unit with World Bank partly funding the asset. The ministry of new and renewable energy is rolling out a scheme for setting up 25 solar parks, including ones with ultra mega solar power projects of 500 MW or more. The ministry expects to commission the projects by FY19 and the plan will have an estimated central financial assistance of R4,050 crore. The scheme has got Presidential sanction last month, according to a senior ministry official. Till December 15, 2014, the country has a total commissioned solar manufacturing capacity of 3,002.66 MW, with Gujarat leading the state tally with operating capacity of 929 MW, followed closely by Rajasthan with 839.5" "MW. At CMP, the stock trades at a P/E of 33x FY14 EPS. In Q2FY15, the Company witnessed an outstanding performance. On YoY basis, topline witnessed a whopping growth rate of 216 percent driven by robust growth in solar systems segment whereas on yoy basis it witnessed a growth of 16 percent to touch Rs. 181 mn. The Company reported PAT from loss making both on yoy and qoq basis to touch Rs. 15.89 mn."

Read more: http://traderscockpit.proboards.com/thread/353/buy-swelectes#ixzz3SwWnNQRK

Tuesday, 14 October 2014

Rsi Multi-Time-Frame Screener available ...

RSI Multi-Time-Frame- Screener is now available at Traderscockpit. Click here for more details . This is in addition to other multi-time-frame screeners already available for adx, Macd, Bollingerband , Moving averages and Ichimoku.
This is great way of screening and getting overall picture across time frames in single click.
Feedback is appreciated.


Friday, 10 October 2014

NIFTY poised for some more correction

NIFTY seems to be now doing the C leg of the correction as per Elliott wave marking done on TradersCockpit.com latest interactive smartphone based charting tool with inbuilt Elliot wave drawing  tools and fibonacci retracement tools. Look how each wave is corresponding with fibonacci levels on the chart. To know more about this charting tool, call 0-805050-2121 or 0-803-927-5521


Wednesday, 8 October 2014

NTPC Bullish Breakout

As spotted on Realtime Screener on TradersCockpit.com, NTPC has broken above the Upper Bollinger Band today.  It had formed Bollinger W Pattern on September 26th, the same day it was spotted on RSI positive divergence screener as well as Inverted Head & Shoulder pattern screener. Also, our proprietory TC Band Positional Buy Indicator also had generated the Bullish signal that day. Find enclosed all the snapshots. 
To know more about our scanners/screeners, call 0-8050502121 / 0-8039275521 or visit www.traderscockpit.com


Thursday, 3 April 2014

Nifty - Some Short Term Correction on cards?


Nifty meets 261.8% fibonacci target, looks like set for a correction,
 bearish upside gap 2 crows candles formed 

Saturday, 8 February 2014

Nifty Analysis

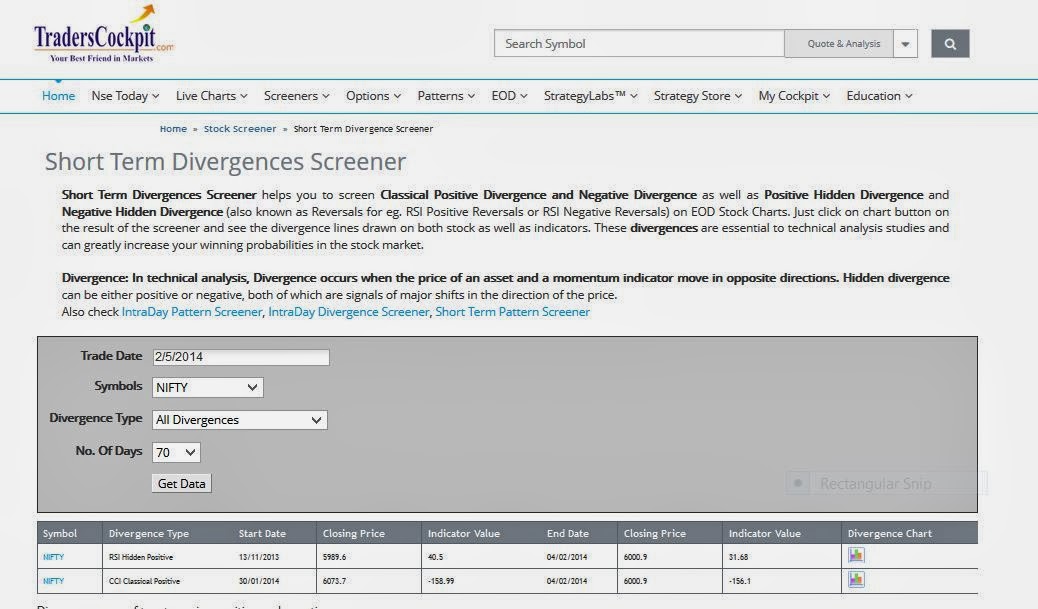
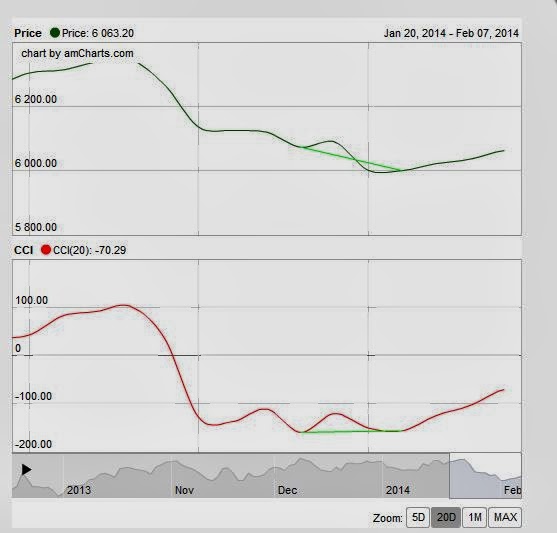
The downfall of Nifty which started on January 24th (it was confirmed by the negative divergence in RSI, CCI etc as shown by our latest divergence screener. See attachments below.).  Click here  to visit the Divergence Screener page.


came to halt with Nifty displaying support near 5930-5950 levels last week. This support level is an important one as it is also the 38.2% fibonacci level (5925) of the entire upmove from 5118 to 6415. The 200 days SMA is at 5977 marking support for Nifty.
The pullback on 4/2/2014 was confirmed by the positive divergence on RSI and CCI as shown by our latest Divergence Screener. See attachments below.

As long as the 5925-5930 support is not broken on a closing basis, the Nifty will attempt to pullback into 38.2% to 61.8% fibonacci retracement levels as shown on the chart attached. But this area is also marked by 2 gaps as well marking them areas of strong resistance. So, resistance in that area could spark fresh downtrend.

Monday, 8 July 2013

Live Markets - Technical Analysis and Advanced Technical Analysis Course in Mumbai on 13,14 and 15th July

Good Morning !!!
 
TradersCockpit is conducting the Technical Aanalysis and Advanced Technical Analysis Live market course  on 13th, 14th & 15th July at Karl Residency, Andheri West, Mumbai.

About the Course
Technical Analysis is all about learning the Art of Making Profits in all market conditions whether rising or falling. Our Training course will make you understand all the important Power Concepts in the Technical Analysis, help you to learn to understand the Charts, screen out stocks, understand when and where to enter and exit and thereby trade successfully. This workshop is completely dedicated to Technical Analysis Techniques and how it can be applied for Trading Successfully in Stocks, Futures&options and Commodities.. The entire training is conducted over 2 full days on a weekend and one in Live Markets on Monday by highly experienced trainers who are regular traders themselves.

Topics Covered
Day 1
  • Introduction to Technical Analysis and shares, futures and options, commodities markets
  • 5 Power Concepts of Technical Analysis
  • 15 Power Concepts of Candlesticks Analysis
  • How to choose the right time frame to Trade
  • Protective Stops - How to setup and use them
  • What it takes to be a successful Professional Trader
  • What makes Trading different from Gambling
  • Chart Analysis - Different Types of Charts - End of Day and Intraday
  • Candlestick Analysis - 33+ Candlesticks patterns, analysis and Trading System
  • Price, Volume, Open Interest, Trend Lines Analysis

Day 2
  • Pivot Point Analysis & Fibonacci Ratios
  • Moving Averages & different types of Moving Averages such as EMA, SMA, WMA
  • Technical Indicators such as MACD, ADX, RSI, Stochastics, CCI, William %R, Bollinger Bands, ATR, OBV, Fractals and understanding the Buy/Sell Signals on them
  • Divergence - the Strongest Technical Signal in Markets - how to understand / use them
  • Protective Stops, Trailing Buy Stops/ Sell Stops
  • Seven Types of Exit Systems
  • Different timeframe (such as Intraday, daily, weekly) based Charting
  • Risk/money management
  • Position Sizing
  • Trading Systems - Entry, exit, Stoploss
  • Trading Discipline
  • Technical Analysis Software - Get free 1 hour Training

Day 3
  • Creating, Designing and Backtesting Trading Systems
  • StrategyLabs – the Backtesting Software Platform
  • STM Trading System
  • Ichimoku Cloud Trading System
  • DM Trading System
  • Live Trading
Trainer for the Course:
 
Anuraag Saboo is the head of Technical Research at TradersCockpit.com and affiliate member of Market Technicians Association, USA. He has done PGDM from Indian Institute of Management (IIM), Bangalore and Electrical and Electronics Engineering from Indian Institute of Technology (IIT) Chennai. He received Gold medal for being topping his Engineering class in IIT from Dr. Manmohan Singh, the then finance minister. He has 16 + years of work experience in varied industries. He has been actively trading Equities and Commodities on Indian exchanges for over 9 years. 
 
Workshop Fee Details: 

1. Technical Analysis on 13th and 14th July 2013
      Rs 8500/-

2. Advanced Technical Analysis on 14th and 15th July
      Rs 10,900

3. Complete Training (Basic+Advanced Technical Analysis) on 13th,  
     14th and 15th July 2013
     Rs. 14,900

More Details About the workshops :

Since we are hard pressed for time, we shall not be holding another Training in Mumbai for next Three Months. So, please ensure you take the advantage of the same.
Happy Trading !!!!

Friday, 5 July 2013

Lupin may give some of the gains , Gail presenting shorting opportunity

Lupin has given excellent returns in last 6 to 9 months, but it may be a good idea to short Lupin (Trading Call) , as RSI Divergence and  Bearish Reversal Candlestick Patterns are suggesting that it may see some correction in next few trading sessions.

Gail also has been in bullish trajectory for last few days , but it is finding tough to cross 335 levels. Also Bearish Engulfing pattern suggests that it may see some correction in next few trading sessions.

Happy Trading !!!!

Disclaimer: 
These notes/comments have been prepared solely to educate those who are interested in the useful application of Technical Analysis. While due care has been taken in preparing these notes/comments, no responsibility can be or is assumed for any consequences resulting out of acting on them.

Tuesday, 2 July 2013

Macd Negative Divergence in DrReddy

Macd Negative Divergence is confirmed in DrReddy and it may be a good shorting candidiate. Stock also formed the Long Legged Doji Candlsetick Pattern today.
With Nifty and other majory index stocks have Harami Bearish Pattern , shorting DrReddy may work out well.
Macd DIvergences and Candlestick patterns can easily be screened using Technical Screener of TradersCockpit. Click here to try ot out!!!

Also check out TradersCockpit Advanced Charts to plot the available divergences. Pasting the snapshot of the same below.
Happy Trading !!!!!
Macd Negative Divergence in DrReddy

Saturday, 15 June 2013

Launching Most comprehensive Online Strategy Backtesting platform on MCX !!!

Dear TradersCockpit.com Users,
TradersCockpit.com is proud to announce the launch of the most comprehensive online Intraday Strategy backtesting platform (Strategy Labs) for commodities in MCX for you on http://commodity.traderscockpit.com
We have submitted and backtested our both buy and sell strategy on the same and the results are attached for your perusal.
5 reasons why you must register/subscribe yourself for Intraday Strategy Labs
1. Now, there is no need for you to depend on Tip-Providers for managing your trades. Through our unique strategy building and backtesting platform - Strategy Labs, you can create your own trading strategies for your commodities, backtest it with historical data, fine tune the strategies (Trading Systems) and then set it live to run on automated basis.
2. You do not need to subscribe to receive financial data for MCX. Our all webapps are integrated with licensed data which is streaming live from MCX.
3. And you do not need to know any programming/scripting language to create/backtest strategies. It is all very intuitively designed and user-friendly.
4. You also do not need to be in front of system to analyse markets/charts for 13.5 hours daily in MCX. All our screeners/Strategy Labs are integrated with SMS/Email to reach out to you with right alert at the right time.
5. Also you need not worry about software upgrades. Today over 25000 traders in India use tools on TradersCockpit.com for managing their trades.
So, come be part of the fastest growing online trading community in India.
Click here to Register for Free ...
Want to know more ?
Click here to visit and fill the enquiry form for FREE demo right now!
Want to know about subscription details?
Click here to visit the subscription page!
Have some queries ?
Contact us on our support no: 0-805050-2121 or email: connect@traderscockpit.com and we will be glad to help you.
Ready to get Started !! Click here to visit TradersCockpit.com Commodity Portal.
BackTested details :
Happy Trading,
Thanks and Regards
TradersCockpit.com Support Team
Support helpline: 0-805050-2121