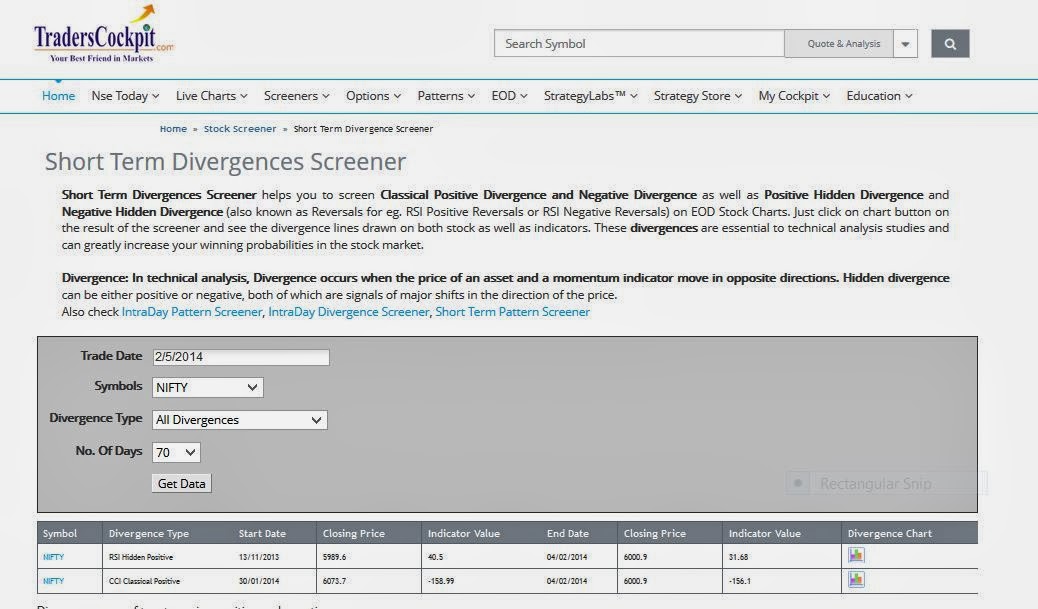
The downfall of Nifty which started on January 24th (it was confirmed by the negative divergence in RSI, CCI etc as shown by our latest divergence screener. See attachments below.). Click here to visit the Divergence Screener page.


came to halt with Nifty displaying support near 5930-5950 levels last week. This support level is an important one as it is also the 38.2% fibonacci level (5925) of the entire upmove from 5118 to 6415. The 200 days SMA is at 5977 marking support for Nifty.
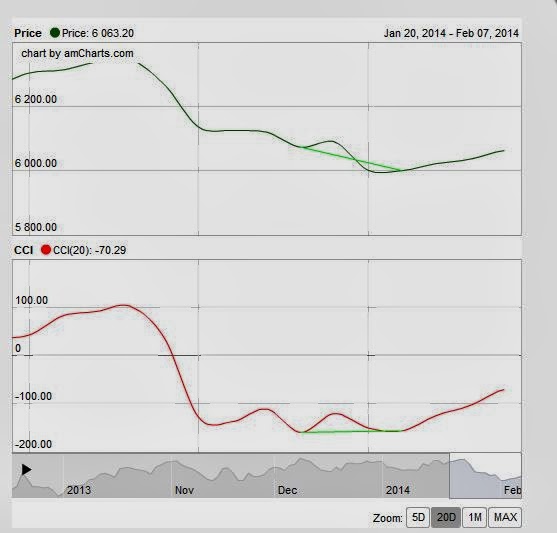
The pullback on 4/2/2014 was confirmed by the positive divergence on RSI and CCI as shown by our latest Divergence Screener. See attachments below.
 As long as the 5925-5930 support is not broken on a closing basis, the Nifty will attempt to pullback into 38.2% to 61.8% fibonacci retracement levels as shown on the chart attached. But this area is also marked by 2 gaps as well marking them areas of strong resistance. So, resistance in that area could spark fresh downtrend.

came to halt with Nifty displaying support near 5930-5950 levels last week. This support level is an important one as it is also the 38.2% fibonacci level (5925) of the entire upmove from 5118 to 6415. The 200 days SMA is at 5977 marking support for Nifty.
The pullback on 4/2/2014 was confirmed by the positive divergence on RSI and CCI as shown by our latest Divergence Screener. See attachments below.